Working with tracks
Create a track from a *.csv file
Suppose the relocation data is stored in a *.csv file, we want to load the data into R and create an RhrTrackST object. We will start with simulating some data.
Generating data
This step can be omitted if you work with your own data.
library(rhr)## Loading required package: grid
## Loading required package: maptools
## Loading required package: sp
## Checking rgeos availability: TRUE
## Loading required package: rasterset.seed(123321)
# Simulate a random walk
dat <- data.frame(rhrPoints(rhrRW()))
## Save the data as csv
write.csv(dat, file.path(tempdir(), "text.csv"))Reading the data and create a track object
dat <- read.csv(file.path(tempdir(), "text.csv"))
head(dat)
## X ones time x y optional
## 1 1 1 2016-03-22 11:30:00 0.7964754 -0.1335861 TRUE
## 2 2 1 2016-03-22 11:31:00 1.7638547 -0.1846211 TRUE
## 3 3 1 2016-03-22 11:32:00 2.3043202 0.8672620 TRUE
## 4 4 1 2016-03-22 11:33:00 3.5920068 1.5670007 TRUE
## 5 5 1 2016-03-22 11:34:00 2.3148058 2.1317617 TRUE
## 6 6 1 2016-03-22 11:35:00 2.6836096 1.3712519 TRUEIn order to create RhrTrackST object, we need the coordinates as SpatialPoints and parsed time stamps. We will first create SpatialPoints for the coordinates.
coords <- SpatialPoints(dat[, c("x", "y")])Next we need to parse the time stamps, this is most easily done with the lubridate package.
library(lubridate)
ts <- ymd_hms(dat$time)
Finally we can create a RhrTrackST object:
track1 <- rhrTrack(coords, ts)
track1
##
## ## ======================================================
## ## Object of class RhrTrackSTR
## ## ======================================================
##
## ## Summary
## ## ------------------------------------------------------
## ## Number of relocation : 1000
## ## Missing relocations : 1000
## ## Traj with time : TRUE
## ## Regular track : TRUE
## ## Start : 2016-03-22 11:30:00
## ## End : 2016-03-23 04:09:00
## ## By : 1M 0S
##
## ## Track data
## ## ------------------------------------------------------
## ## x : numeric
## ## y : numeric
## ## sp.ID : integer
## ## time : POSIXct,POSIXt
## ## endTime : POSIXct,POSIXt
## ## timeIndex : integer
## ## ones : integer
## ## ======================================================
##
## ## Segments data
## ## ------------------------------------------------------
## ## x0 : numeric
## ## x1 : numeric
## ## y0 : numeric
## ## y1 : numeric
## ## start : POSIXct,POSIXt
## ## end : POSIXct,POSIXt
## ## distance : numeric
## ## direction : numeric
## ## ======================================================
## Working with tracks
Plot
There is plot method for tracks.
plot(track1)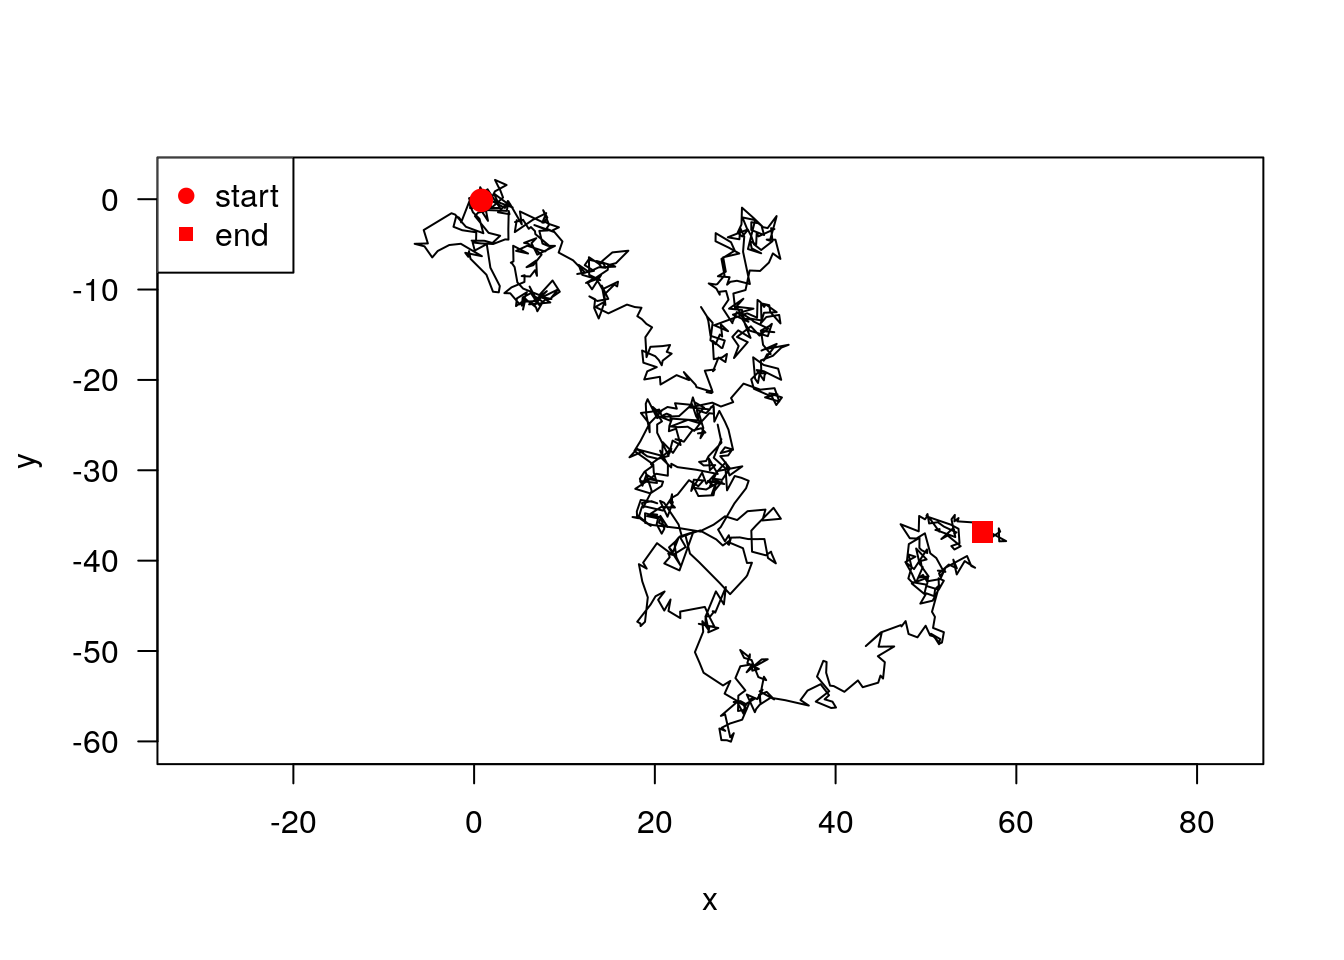
Sometimes it my be desirable to map a certain attribute on the path. In the next example, we will use variable line with as a function of the step length.
trackSeg <- rhrSegments(track1, spatial = TRUE)
head(trackSeg)
## distance direction start end
## 1 0.9687246 NA 2016-03-22 11:31:00 2016-03-22 11:30:00
## 2 1.1826078 1.1488708 2016-03-22 11:32:00 2016-03-22 11:31:00
## 3 1.4655275 -0.5983960 2016-03-22 11:33:00 2016-03-22 11:32:00
## 4 1.3964946 2.2274876 2016-03-22 11:34:00 2016-03-22 11:33:00
## 5 0.8452167 -3.8445222 2016-03-22 11:35:00 2016-03-22 11:34:00
## 6 0.2115200 0.1981348 2016-03-22 11:36:00 2016-03-22 11:35:00library(scales)
plot(trackSeg, lwd = rescale(trackSeg$distance, c(0.01, 4)),
axes = TRUE)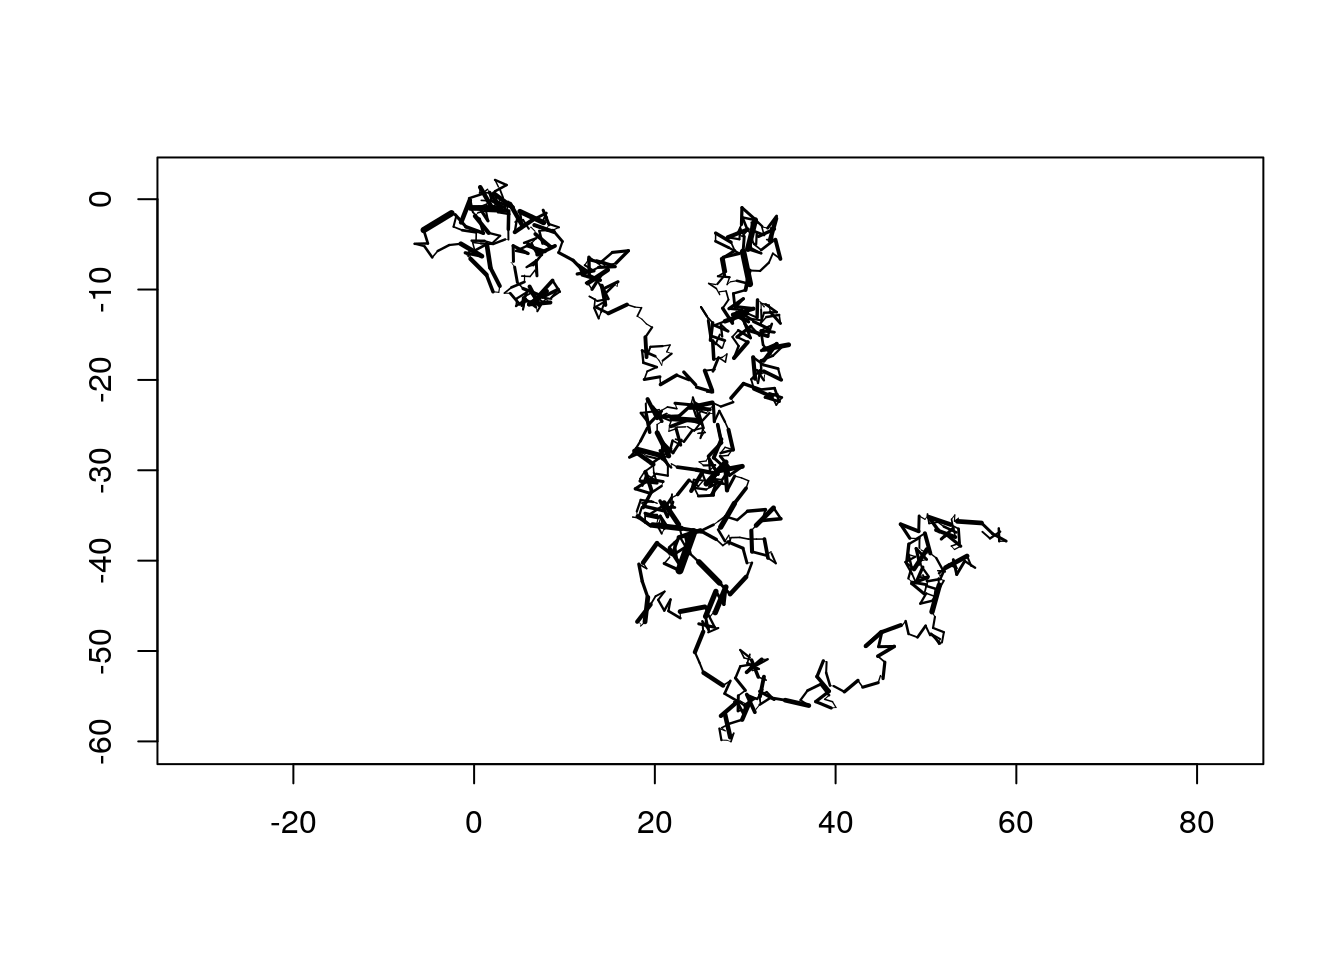
Or we could color segments according to some path characteristic.
cols <- colorRampPalette(c("blue", "red"))(length(trackSeg$distance))
cols <- cols[order(trackSeg$distance)]

plot(trackSeg, lwd = 2, col = cols,  axes = TRUE)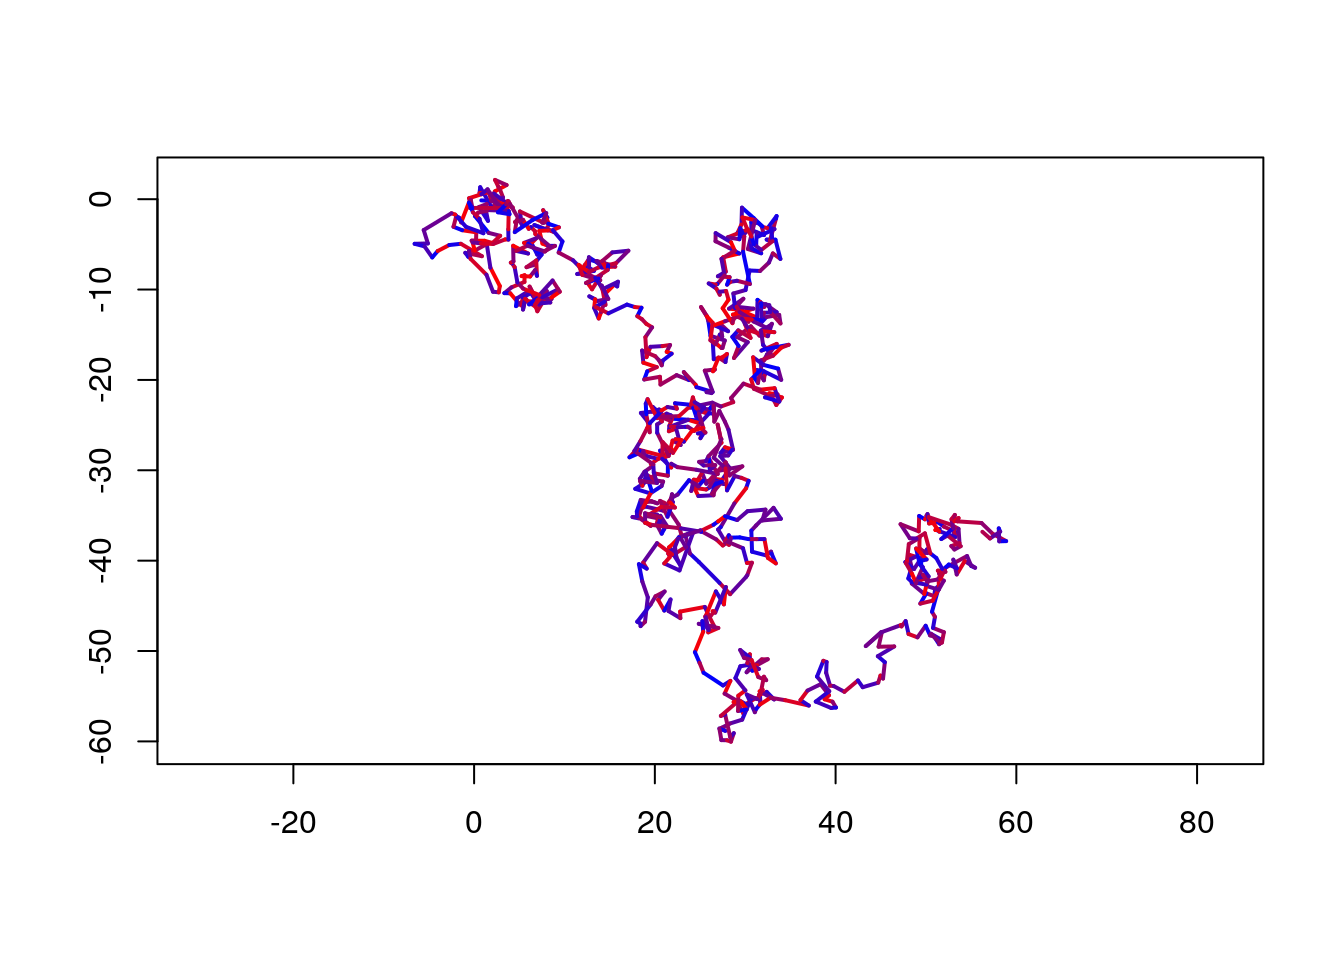
Segments
We can extract the segments and stats there of with rhrSegments:
seg1 <- rhrSegments(track1)seg1 is a data.frame with the start and end point of each segment, time and some basic statistics, such as
- distance
- duration
- speed
- direction.
We could for example plot the distance that animal moved over time.
plot(rhrTimes(track1)[-1], seg1$distance, type = "l", xlab = "time", ylab = "movement distance")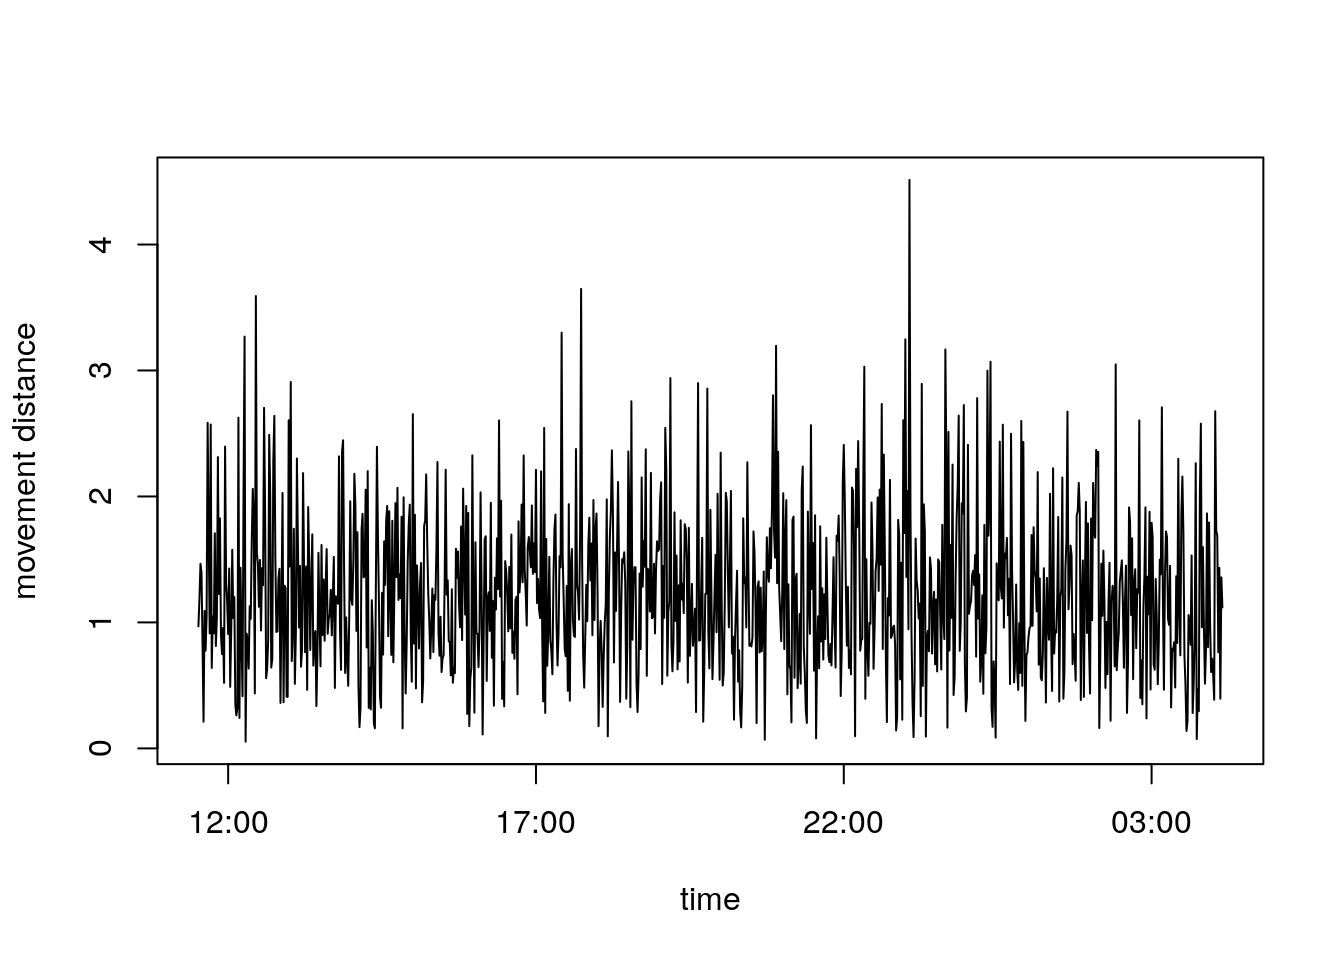
Net Square displacement
The function rhrNSD allows the calculation of the the net square displacement.
nsd <- rhrNSD(track1)
plot(nsd, type = "l")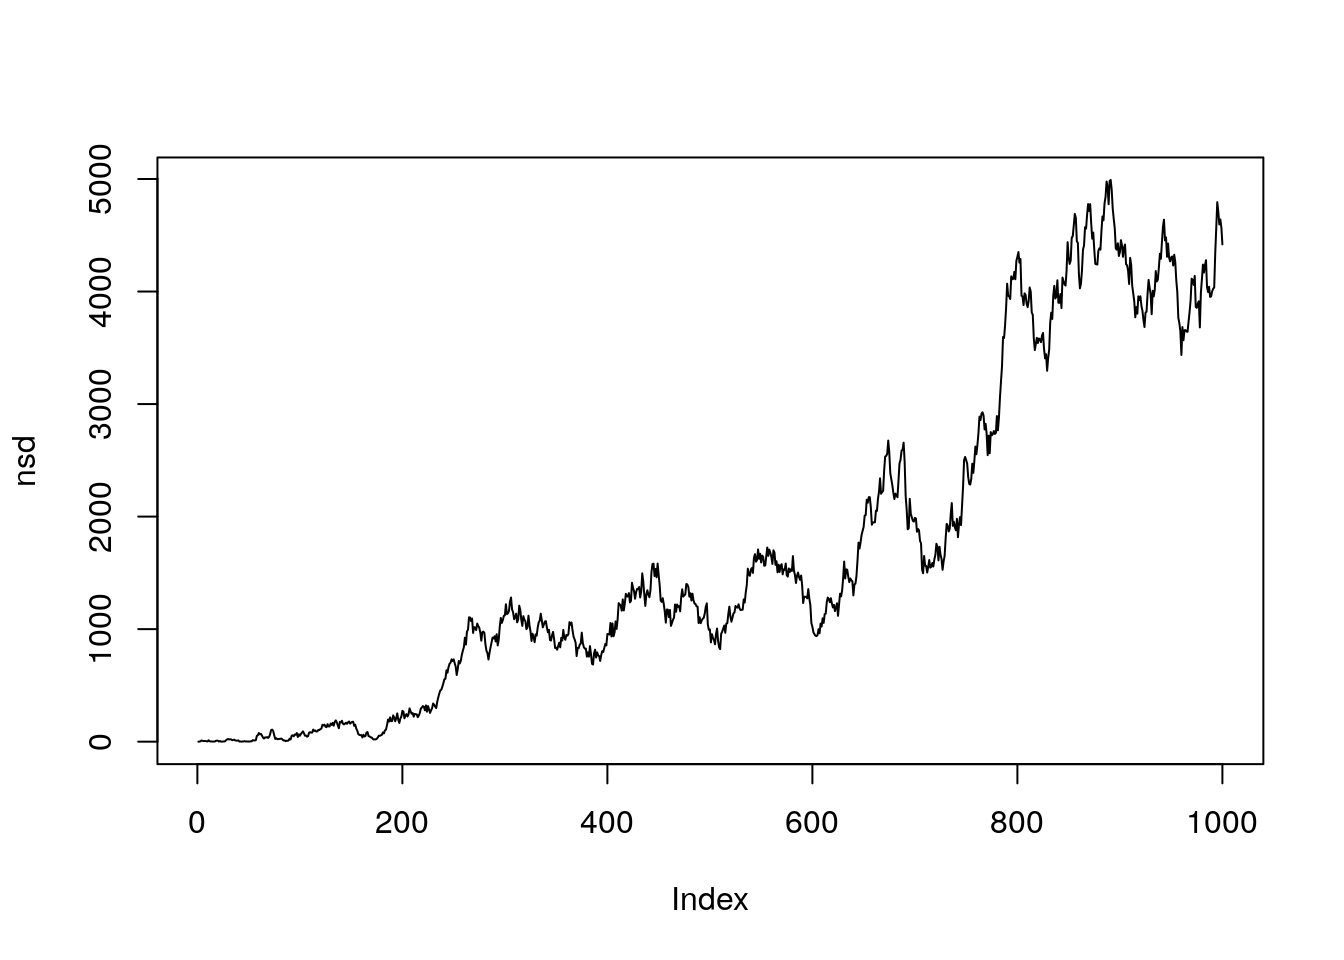
Tracks with properties
It is also possible to add some additional information to a track (e.g., behavioral state, landscape attributes).
dat <- read.csv(file.path(tempdir(), "text.csv"))
head(dat)
## X ones time x y optional
## 1 1 1 2016-03-22 11:30:00 0.7964754 -0.1335861 TRUE
## 2 2 1 2016-03-22 11:31:00 1.7638547 -0.1846211 TRUE
## 3 3 1 2016-03-22 11:32:00 2.3043202 0.8672620 TRUE
## 4 4 1 2016-03-22 11:33:00 3.5920068 1.5670007 TRUE
## 5 5 1 2016-03-22 11:34:00 2.3148058 2.1317617 TRUE
## 6 6 1 2016-03-22 11:35:00 2.6836096 1.3712519 TRUEWe proceed in the same way as before, but make use of a SpatialPointsDataFrame.
# simulate some env covariates
attr <- data.frame(mode = sample(c("feeding", "sleeping", "moving"), nrow(dat), TRUE),
                   elevation = runif(100, 500, nrow(dat)))

coords <- SpatialPointsDataFrame(dat[, c("x", "y")], attr)
Next we need to parse the time stamps, this is most easily done with the lubridate package.
ts <- ymd_hms(dat$time)Finally we can create a RhrTrackST object:
track1 <- rhrTrack(coords, ts)
track1
##
## ## ======================================================
## ## Object of class RhrTrackSTR
## ## ======================================================
##
## ## Summary
## ## ------------------------------------------------------
## ## Number of relocation : 1000
## ## Missing relocations : 1000
## ## Traj with time : TRUE
## ## Regular track : TRUE
## ## Start : 2016-03-22 11:30:00
## ## End : 2016-03-23 04:09:00
## ## By : 1M 0S
##
## ## Track data
## ## ------------------------------------------------------
## ## x : numeric
## ## y : numeric
## ## sp.ID : integer
## ## time : POSIXct,POSIXt
## ## endTime : POSIXct,POSIXt
## ## timeIndex : integer
## ## mode : factor
## ## elevation : numeric
## ## ======================================================
##
## ## Segments data
## ## ------------------------------------------------------
## ## x0 : numeric
## ## x1 : numeric
## ## y0 : numeric
## ## y1 : numeric
## ## start : POSIXct,POSIXt
## ## end : POSIXct,POSIXt
## ## distance : numeric
## ## direction : numeric
## ## ======================================================
## Lets get points and the segments back from the track:
seg1 <- rhrSegments(track1, spatial = TRUE)
head(seg1)
## distance direction start end
## 1 0.9687246 NA 2016-03-22 11:31:00 2016-03-22 11:30:00
## 2 1.1826078 1.1488708 2016-03-22 11:32:00 2016-03-22 11:31:00
## 3 1.4655275 -0.5983960 2016-03-22 11:33:00 2016-03-22 11:32:00
## 4 1.3964946 2.2274876 2016-03-22 11:34:00 2016-03-22 11:33:00
## 5 0.8452167 -3.8445222 2016-03-22 11:35:00 2016-03-22 11:34:00
## 6 0.2115200 0.1981348 2016-03-22 11:36:00 2016-03-22 11:35:00The attributes are lost from track1. That is because R does not know what to do with it, because each segment has a start and end point where the attributes are measured. We can add easily add attributes to segments with by asking for the points with attributes:
pts <- rhrPoints(track1)
head(pts)
## mode elevation time
## 1 moving 909.2007 2016-03-22 11:30:00
## 2 sleeping 893.0978 2016-03-22 11:31:00
## 3 feeding 654.9305 2016-03-22 11:32:00
## 4 sleeping 687.6742 2016-03-22 11:33:00
## 5 sleeping 899.2189 2016-03-22 11:34:00
## 6 feeding 905.2809 2016-03-22 11:35:00Lets add the movement mode at the start (mode_end) and at the end (mode_start) to each segment, we can do this with:
seg1$mode_start <- pts$mode[-nrow(pts)]
seg1$mode_end <- pts$mode[-1]
Similarly we could also take the mean elevation of the start and end point:
seg1$mean_ele <- (pts$elevation[-1] + pts$elevation[-nrow(pts)])/2As shown before, we can use these attributes to create plots:
plot(seg1, col = as.numeric(as.factor(seg1$mode_start)))