Site Fidelity
Background
Implementation of site fidelity is based on suggested methods by Spencer et al. 1990. As a definition for the presence they use:
Site fidelity exists, if the observed area an animal uses is smaller than the area used if an indiviudals movement was random (Munger 1984).
They then assumed, that if an animal exhibits site fidelity, it posses an home range. To test for the existence of site fidelity, they used three metrics:
- A linearity index (LI)
- The mean squared distance from the center of activity (MSD)
In rhr the linearity index and the mean squared distance from the center of activity are implemented.
Calculation
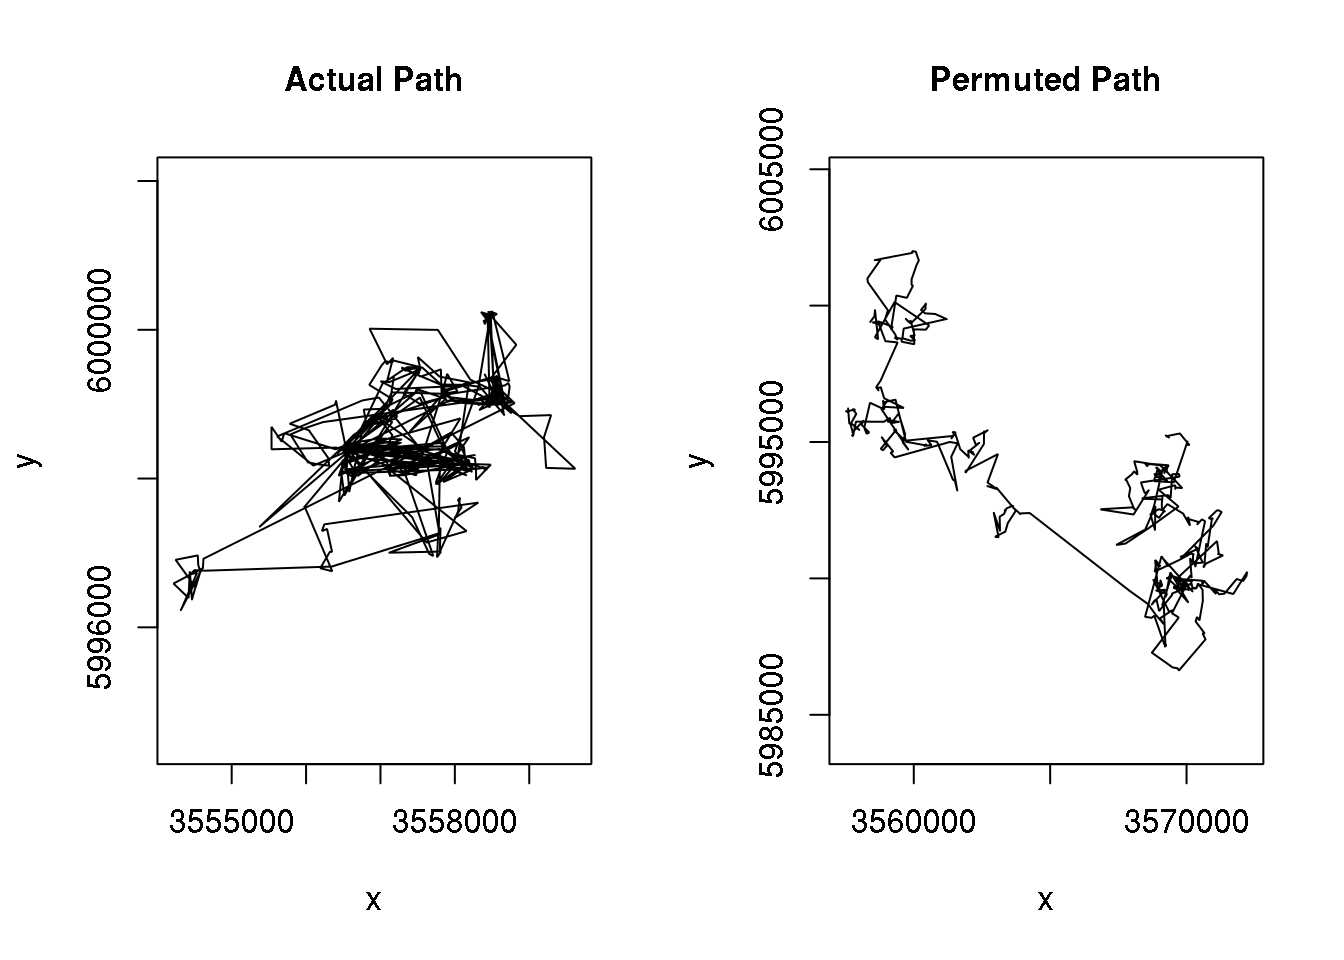
The test whether or not animal exhibits site fidelity the LI and MSD metric a compared to random trajectory. Randomly permuting step lengths and connected them with random angles. This is done \(n = 100\) times and for each random trajectory LI and MSD are calculated to obtain a distribution of these values. Finally the values for LI and MSD are compared to the distribution LI and MSD for random trajectories.
Interpretation
rhr produces an histogram for LI and MSD and indicates where the critical threshold (red dashed lines) is located (by default using \(\alpha = 0.05\)) and the observed value (red solid line).
sf <- rhrSiteFidelity(datSH[1:500, 2:3], n = 500)
plot(sf)
## stat_bin: binwidth defaulted to range/30. Use 'binwidth = x' to adjust this.
## stat_bin: binwidth defaulted to range/30. Use 'binwidth = x' to adjust this.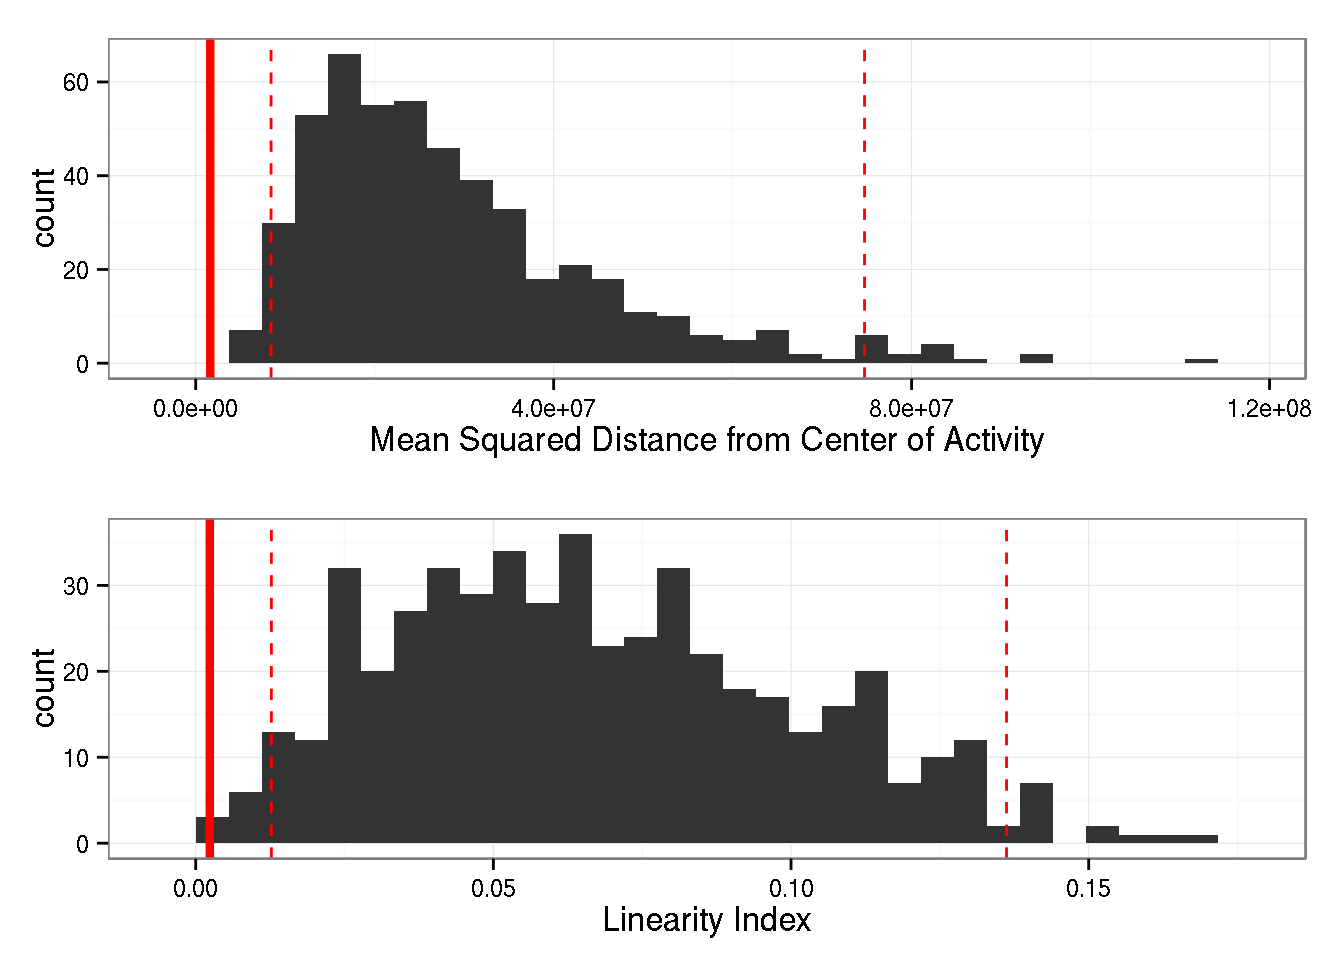
If the solid red line is below the interval indicated by the red dashed lines, one can conclude that site fidelity is present.